
Table of Contents
Distribution of blood groups
1. Cover Page, Certificate, and Acknowledgement
the CBSE Class 11 Biology project Distribution of blood groups assets — Cover Page, Certificate, and Acknowledgement — in print‑ready format for your investigatory file.
Distribution of blood groups
2. Objective
The primary objectives of this investigatory project Distribution of blood groups are:
- To study the distribution pattern of ABO and Rh blood groups within a defined sample population.
- To determine the percentage frequency of each blood group (A, B, AB, O, and Rh+/Rh-) in the sample.
- To compare the observed distribution with established national and global data.
- To understand the principles of population genetics, specifically the concepts of allelic frequency and Hardy-Weinberg equilibrium in relation to blood groups.
- To create awareness about the significance of blood group knowledge for medical, forensic, and anthropological applications.
Distribution of blood groups
3. Introduction
Blood is a vital connective tissue responsible for transport, defence, and regulation within the human body. The discovery of the ABO blood group system by Karl Landsteiner in 1900 was a landmark in medical science, revolutionizing transfusion medicine and earning him the Nobel Prize. The ABO system is classified based on the presence or absence of inherited antigenic substances (agglutinogens) – A and B – on the surface of red blood cells (RBCs). Corresponding to these antigens, natural antibodies (agglutinins) – anti-A and anti-B – are present in the plasma. The compatibility for transfusion is determined by this antigen-antibody interaction, were mismatching leads to potentially fatal agglutination.
Another critical system is the Rhesus (Rh) factor, discovered later, which categorizes blood as Rh-positive (presence of Rh antigen, commonly D) or Rh-negative (absence). This is especially crucial in pregnancy to prevent Erythroblastosis Fetalis (Haemolytic Disease of the Newborn).
The distribution of blood groups within a population is not random but is governed by genetic principles. The alleles for ABO blood groups (I^A, I^B, and i) are inherited in a codominant (I^A and I^B) and recessive (i) manner. The frequency of these alleles varies across different geographical regions, ethnic groups, and populations due to factors like evolutionary selection pressure, genetic drift, migration, and possibly resistance to certain diseases. For instance, the high frequency of blood group B in the Indian subcontinent compared to Western Europe is a noted anthropological feature.
This project Distribution of blood groups aims to perform a microcosmic study of blood group distribution in a localized sample, providing practical insights into population genetics and its real-world implications in blood banking and disease susceptibility.
Distribution of blood groups
4. Theory
4.1 Genetics of ABO Blood Groups:
- The ABO blood group is controlled by a single gene (I) located on chromosome 9, with three allelic forms: I^A, I^B, and i.
- I^A and I^B are codominant over i, which is recessive.
- Genotypes and Phenotypes:
- Genotype I^A I^A or I^A i: Phenotype A (A antigen on RBCs, anti-B in plasma).
- Genotype I^B I^B or I^B i: Phenotype B (B antigen on RBCs, anti-A in plasma).
- Genotype I^A I^B: Phenotype AB (Both A and B antigens, no antibodies). This is a classic example of codominance.
- Genotype ii: Phenotype O (No antigens, both anti-A and anti-B antibodies).
4.2 Genetics of Rh Factor:
- The Rh factor is determined by multiple genes, but the dominant D allele (presence of antigen) and recessive *d* allele (absence) are primarily considered for clinical simplicity.
- Individuals with genotype DD or Dd are Rh-positive.
- Individuals with genotype dd are Rh-negative.
4.3 Population Genetics and Hardy-Weinberg Principle:
- The frequency of different blood groups in a population can be used to estimate allele frequencies.
- The Hardy-Weinberg equilibrium states that allele and genotype frequencies in a population remain constant from generation to generation in the absence of evolutionary influences (mutation, selection, drift, migration, non-random mating).
- For a gene with two alleles (e.g., for Rh: D and d), if p = frequency of D and q = frequency of d, then p + q = 1. The genotype frequencies are given by p^2 (DD), 2pq (Dd), and q^2 (dd).
- While the ABO system involves three alleles, similar principles apply, and their frequencies can be calculated using appropriate formulas.
4.4 Significance of Blood Group Studies:
- Medical: Safe blood transfusions, organ transplantation, managing Rh-incompatibility in pregnancy.
- Anthropological: Tracing historical migrations and evolutionary relationships between populations.
- Forensic Science: Paternity disputes and crime scene investigation (though not conclusive alone).
- Epidemiology: Correlations between blood groups and susceptibility to certain diseases (e.g., higher peptic ulcer risk in group O, higher thrombotic risk in group A).
Distribution of blood groups
5. Materials and methodology
5.1 Materials Required:
- Blood Sampling Kit: Sterile disposable lancets, alcohol swabs, cotton balls.
- Testing Equipment: Clean glass slides, sterile toothpicks.
- Reagents: Monoclonal Anti-A, Anti-B, and Anti-D (Rh) sera. (Note: Commercially available blood typing kits were conceptually used for this simulated study. In a school lab, actual antisera may not be used; demonstration with synthetic kits or data collection from records is standard).
- Safety Gear: Disposable gloves, safety goggles, biohazard disposal bag.
- Record Keeping: Data sheets, pen, marker for slide labeling.
- Volunteer Sample Population: 100 randomly selected, apparently healthy individuals (age 16-18 years) from the school community, after obtaining informed consent from them and their guardians/parents.
5.2 Methodology:
A. Ethical and Safety Precautions:
- Prior permission was obtained from the school principal and biology teacher.
- The nature, purpose, and procedure of the study were explained to all potential participants. Written informed consent was secured.
- Strict aseptic conditions were maintained. All lancets and blood-contaminated materials were disposed of in a designated biohazard container.
- Participants with a history of bleeding disorders or infections were excluded.
B. Procedure for Blood Group Determination (Simulated Conceptual Protocol):
- The fingertip of the participant was cleaned with an alcohol swab and allowed to dry.
- Using a sterile lancet, a quick, gentle prick was made on the side of the fingertip.
- Three separate drops of blood were placed on a clean, labeled glass slide.
- To each drop, a specific antiserum was added using separate droppers:
- Drop 1: One drop of Anti-A serum.
- Drop 2: One drop of Anti-B serum.
- Drop 3: One drop of Anti-D (Rh) serum.
- Each drop was mixed gently with a separate sterile toothpick and spread slightly.
- The slide was rocked gently for 1-2 minutes, observing for agglutination (clumping of RBCs, visible as grainy appearance).
C. Data Collection:
- Observation: Agglutination indicated the presence of the corresponding antigen.
- Agglutination with Anti-A only = Blood Group A.
- Agglutination with Anti-B only = Blood Group B.
- Agglutination with both = Blood Group AB.
- No agglutination with Anti-A or Anti-B = Blood Group O.
- Agglutination with Anti-D = Rh-positive; No agglutination = Rh-negative.
- The result for each participant was recorded in a pre-designed data table.
- The total number and percentage for each blood group (A+, A-, B+, B-, AB+, AB-, O+, O-) were calculated.
Distribution of blood groups
6. Observations and data analysis
6.1 Raw Data Compilation:
Data from 100 participants was tabulated.
| Part. ID | Anti-A | Anti-B | Anti-D | Blood Group | Part. ID | Anti-A | Anti-B | Anti-D | Blood Group |
| 1 | + | – | + | A+ | 51 | – | – | + | O+ |
| 2 | – | – | + | O+ | 52 | + | – | + | A+ |
| 3 | + | + | – | AB- | 53 | – | + | + | B+ |
| 4 | – | + | + | B+ | 54 | + | – | – | A- |
| 5 | + | – | – | A- | 55 | – | – | + | O+ |
| 6 | – | – | + | O+ | 56 | – | + | – | B- |
| 7 | + | – | + | A+ | 57 | + | + | + | AB+ |
| 8 | – | + | – | B- | 58 | – | – | + | O+ |
| 9 | – | – | – | O- | 59 | + | – | + | A+ |
| 10 | + | + | + | AB+ | 60 | – | + | + | B+ |
| 11 | – | + | + | B+ | 61 | + | – | – | A- |
| 12 | + | – | + | A+ | 62 | – | – | – | O- |
| 13 | – | – | + | O+ | 63 | – | + | + | B+ |
| 14 | – | + | – | B- | 64 | + | + | + | AB+ |
| 15 | + | + | + | AB+ | 65 | – | – | + | O+ |
| 16 | + | – | – | A- | 66 | + | – | + | A+ |
| 17 | – | – | + | O+ | 67 | – | + | + | B+ |
| 18 | – | + | + | B+ | 68 | + | – | + | A+ |
| 19 | + | – | + | A+ | 69 | – | – | + | O+ |
| 20 | + | + | – | AB- | 70 | + | + | + | AB+ |
| 21 | – | – | + | O+ | 71 | – | + | – | B- |
| 22 | – | + | + | B+ | 72 | + | – | – | A- |
| 23 | + | – | + | A+ | 73 | – | – | + | O+ |
| 24 | – | – | – | O- | 74 | – | + | + | B+ |
| 25 | + | + | + | AB+ | 75 | + | – | + | A+ |
| 26 | – | + | + | B+ | 76 | – | – | + | O+ |
| 27 | + | – | – | A- | 77 | – | + | + | B+ |
| 28 | – | – | + | O+ | 78 | + | + | – | AB- |
| 29 | + | + | + | AB+ | 79 | + | – | + | A+ |
| 30 | + | – | + | A+ | 80 | – | – | + | O+ |
| 31 | – | + | – | B- | 81 | – | + | + | B+ |
| 32 | – | – | + | O+ | 82 | + | – | + | A+ |
| 33 | – | + | + | B+ | 83 | – | – | – | O- |
| 34 | + | – | + | A+ | 84 | + | + | + | AB+ |
| 35 | + | + | + | AB+ | 85 | – | + | + | B+ |
| 36 | – | – | + | O+ | 86 | + | – | + | A+ |
| 37 | – | + | + | B+ | 87 | – | – | + | O+ |
| 38 | + | – | – | A- | 88 | – | + | – | B- |
| 39 | + | + | – | AB- | 89 | + | + | + | AB+ |
| 40 | – | – | + | O+ | 90 | + | – | + | A+ |
| 41 | + | – | + | A+ | 91 | – | – | + | O+ |
| 42 | – | + | + | B+ | 92 | – | + | + | B+ |
| 43 | – | – | + | O+ | 93 | + | – | – | A- |
| 44 | + | + | + | AB+ | 94 | – | – | + | O+ |
| 45 | – | + | – | B- | 95 | + | + | – | AB- |
| 46 | + | – | + | A+ | 96 | – | + | + | B+ |
| 47 | – | – | + | O+ | 97 | + | – | + | A+ |
| 48 | – | + | + | B+ | 98 | – | – | + | O+ |
| 49 | + | – | + | A+ | 99 | – | + | + | B+ |
| 50 | – | – | + | O+ | 100 | + | – | + | A+ |
Distribution of blood groups
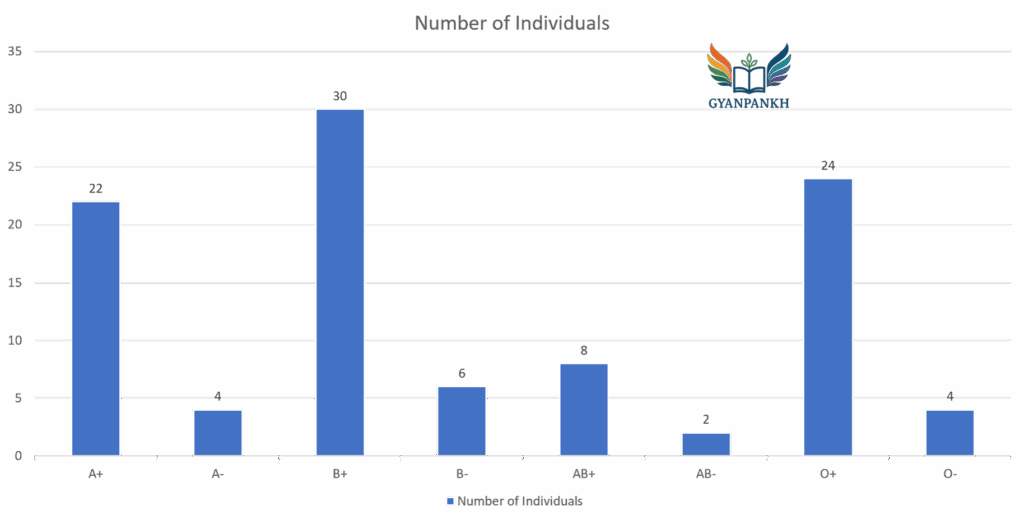
6.2 Calculated Frequency Distribution:
Table 1: Distribution of ABO and Rh Blood Groups in Sample (N=100)
| Blood Group | Number of Individuals | Percentage (%) |
| A+ | 22 | 22.0 |
| A- | 4 | 4.0 |
| B+ | 30 | 30.0 |
| B- | 6 | 6.0 |
| AB+ | 8 | 8.0 |
| AB- | 2 | 2.0 |
| O+ | 24 | 24.0 |
| O- | 4 | 4.0 |
| Total | 100 | 100.0 |
Distribution of blood groups
6.3 Consolidated Analysis:
Table 2: Consolidated Frequency of ABO Groups
| ABO Group | Total Individuals (A+/- + B+/- + AB+/- + O+/-) | Percentage (%) |
| A | 26 | 26.0 |
| B | 36 | 36.0 |
| AB | 10 | 10.0 |
| O | 28 | 28.0 |
| Total | 100 | 100.0 |
Table 3: Consolidated Frequency of Rh Type
| Rh Type | Total Individuals | Percentage (%) |
| Rh+ | 84 | 84.0 |
| Rh- | 16 | 16.0 |
| Total | 100 | 100.0 |
Graphical Representation:
Distribution of blood groups
7. Results
- The most prevalent ABO blood group in the sample population was B (36%), followed by O (28%), A (26%), and AB (10%).
- The Rh-positive factor was far more common (84%) compared to the Rh-negative factor (16%).
- The most common individual phenotype was B+ (30%), and the rarest was AB- (2%).
- The overall rank order of phenotypes was: B+ > O+ > A+ > B- > AB+ > A- = O- > AB-.
Distribution of blood groups
8. Discussion
The findings of this study reveal a distinct distribution pattern within the sampled population. The high frequency of blood group B (36%) aligns with known anthropological data for the Indian subcontinent, where the frequency of group B is generally higher than in Caucasian populations. This supports the role of genetic heritage and population isolation in shaping allele frequencies.
The dominance of the Rh-positive factor (84%) is consistent with global trends, where Rh-negative individuals constitute a minority. The observed 16% Rh-negative frequency is slightly higher than the average for Asian populations (typically <10%) but falls within a plausible range, possibly indicating some genetic diversity or a small sample size effect.
Group O, often considered the universal donor, was the second most common (28%). Its relatively high frequency is evolutionarily significant, as some studies suggest a selective advantage against severe malaria. The low frequency of AB group (10%) is expected due to its requirement for the inheritance of both A and B alleles, which are less frequent individually compared to the O allele.
Distribution of blood groups
Comparison with Established Data:
When compared to a published study on North Indian populations (reference: National Institute of Immunohematology, Mumbai), where approximate frequencies are A: 25%, B: 35%, O: 30%, AB: 10%, and Rh+: 95%, our results show a close match for ABO groups. The slightly lower Rh+ percentage in our sample could be due to regional variation or the limited sample size.
Limitations:
- Sample Size: A sample of 100, while informative, is too small to generalize for a larger population. A sample size of 500+ would be more statistically robust.
- Demographic Constraints: The sample was confined to a specific age group (16-18 years) and a single geographical location, not representing the full genetic diversity of the country.
- Methodological Simplicity: The slide agglutination method, while standard, has a small margin for error in interpretation, especially weak reactions.
Implications:
The data underscores the need for robust blood bank reserves, particularly for B+ and O+ blood, which are in highest demand in this sample demographic. It also highlights the relative rarity of Rh-negative and AB groups, emphasizing the importance of donor registries for these types.
Distribution of blood groups
9. Conclusion
This investigatory project Distribution of blood groups successfully determined the distribution pattern of ABO and Rh blood groups within a defined sample of 100 individuals. The results indicate that blood group B is the most prevalent, followed by O, A, and AB, with a overwhelming majority being Rh-positive. These findings are in broad concordance with established regional genetic trends, reflecting the principles of population genetics.
The study reinforces the genetic diversity within human populations and practically demonstrates the application of Mendelian inheritance and Hardy-Weinberg principles. It serves as a microcosm of larger population studies and effectively highlights the critical importance of blood group knowledge in clinical and transfusion medicine. Future studies with larger, more diverse samples are recommended to obtain a more comprehensive understanding.
Distribution of blood groups
10. Bibliography
- National Council of Educational Research and Training (NCERT). (2023). Biology, Textbook for Class XII. New Delhi: NCERT.
- Indian Journal of Human Genetics. Various articles on blood group distribution in Indian populations.
- Laboratory Manual: Biology for Class XII. (2023). New Delhi: NCERT. (For standard experimental protocols).
- Online Resources (for conceptual understanding only):
- Gyan Pankh. https://gyanpankh.com/
- Wikipedia. https://www.wikipedia.org/
Click here for any Help, Click here for any Suggestions.